Stop overwhelming your audience with walls of numbers. This Economics Data Infographic is engineered to turn intricate financial data into compelling, easy-to-understand visual stories. With a sleek, modern layout and sharp vector design, it enables you to present economic indicators, market analysis, growth metrics, and performance reviews with confidence and professionalism. Whether you’re delivering a quarterly report, briefing executives, or teaching economic principles, this template delivers the clarity and impact your content deserves.
Powerful Design for Data-Driven Decision Making
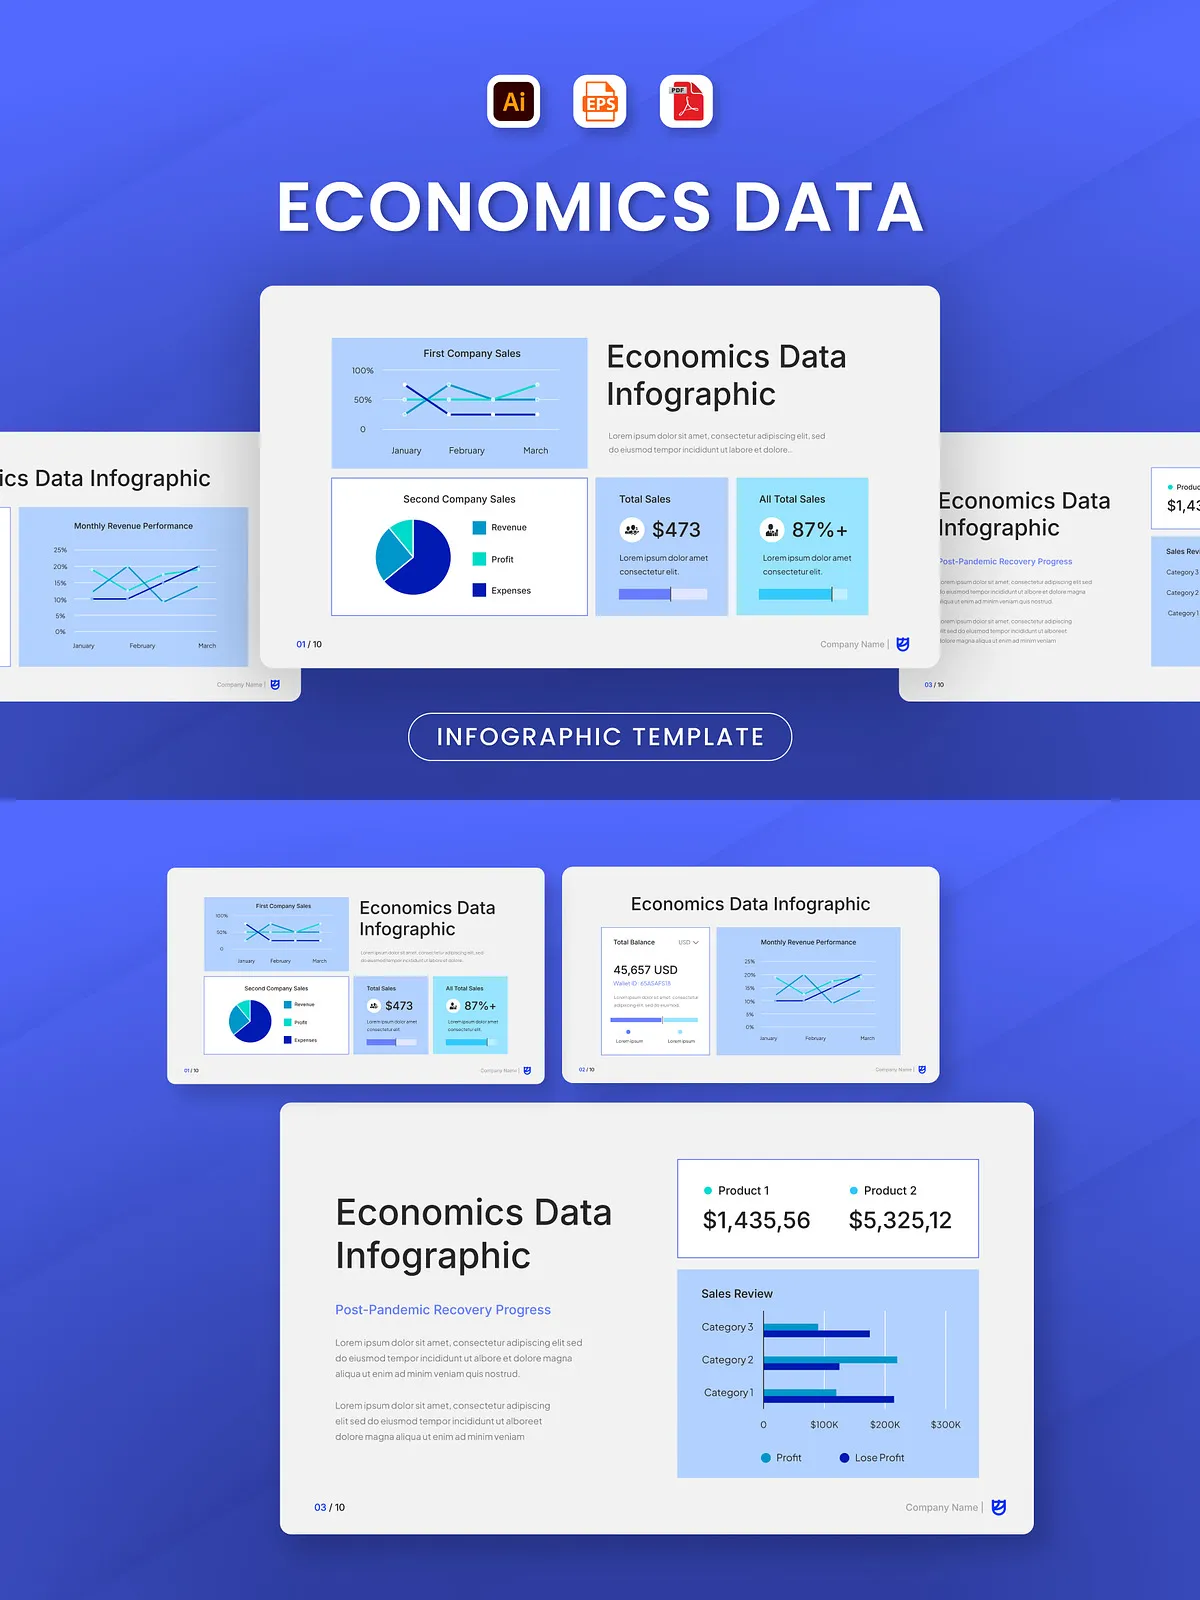
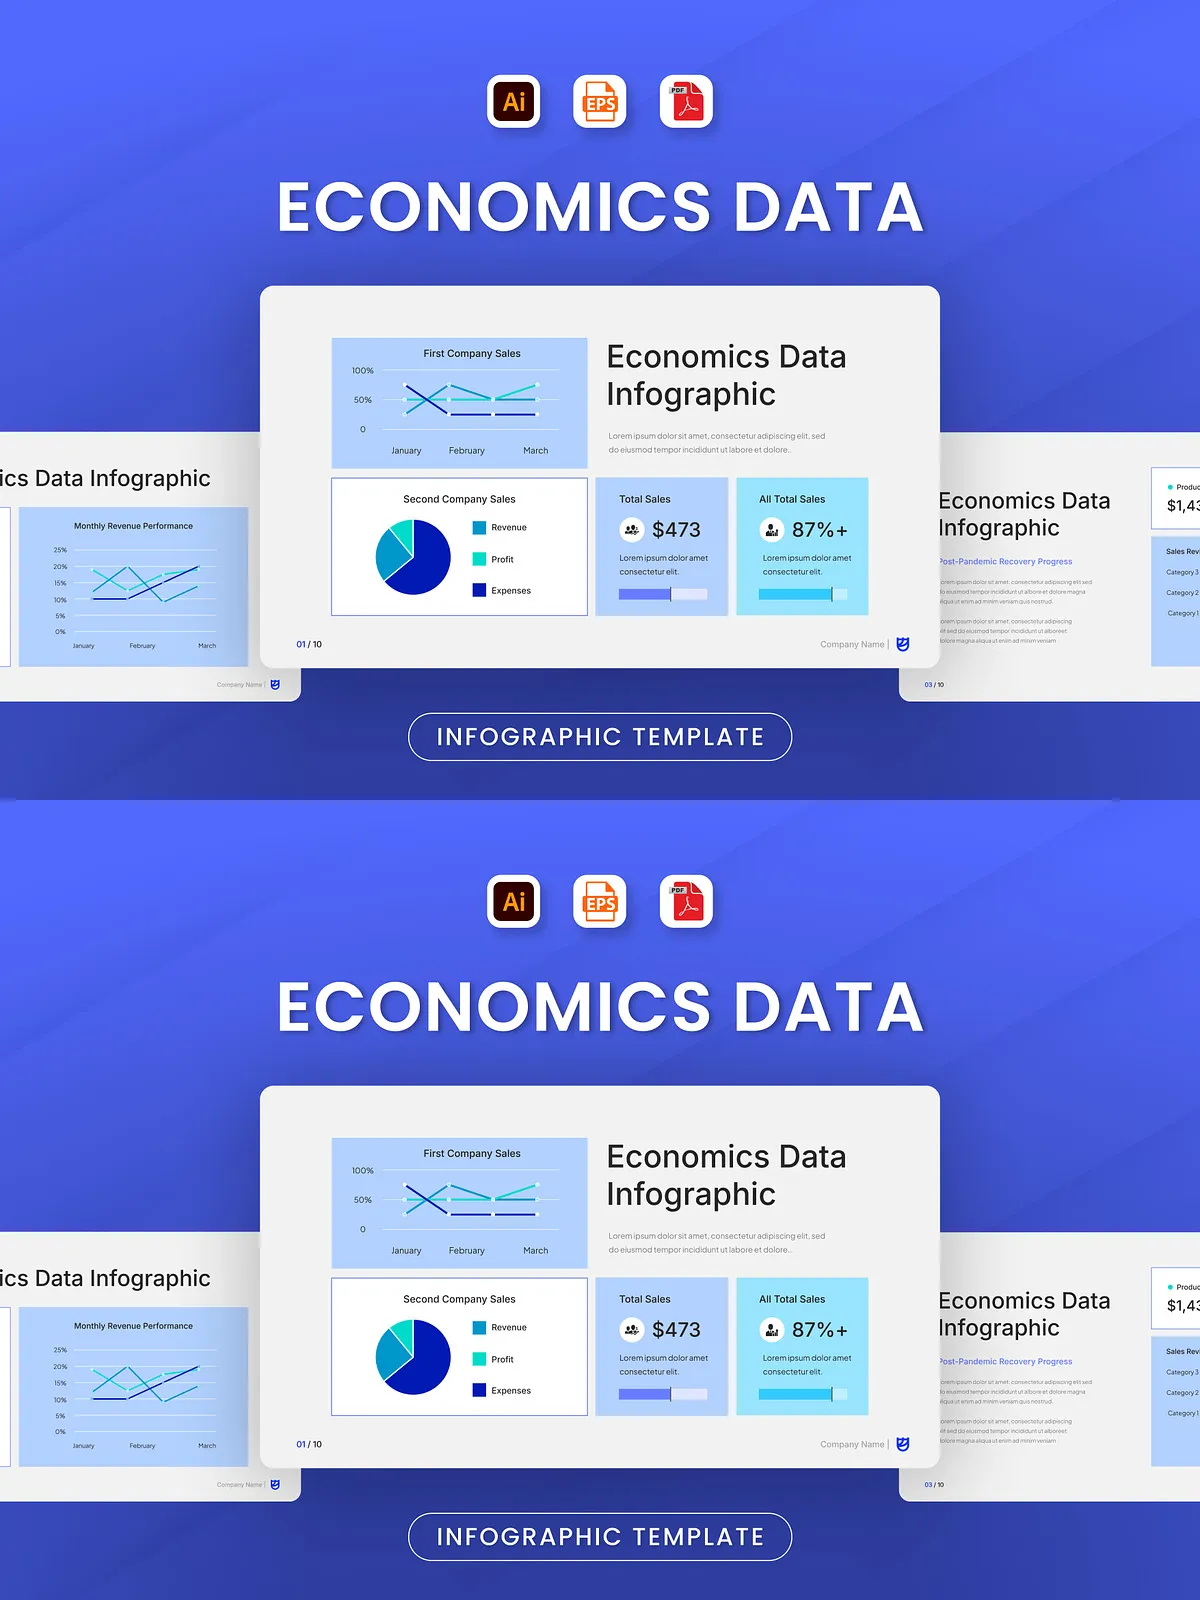
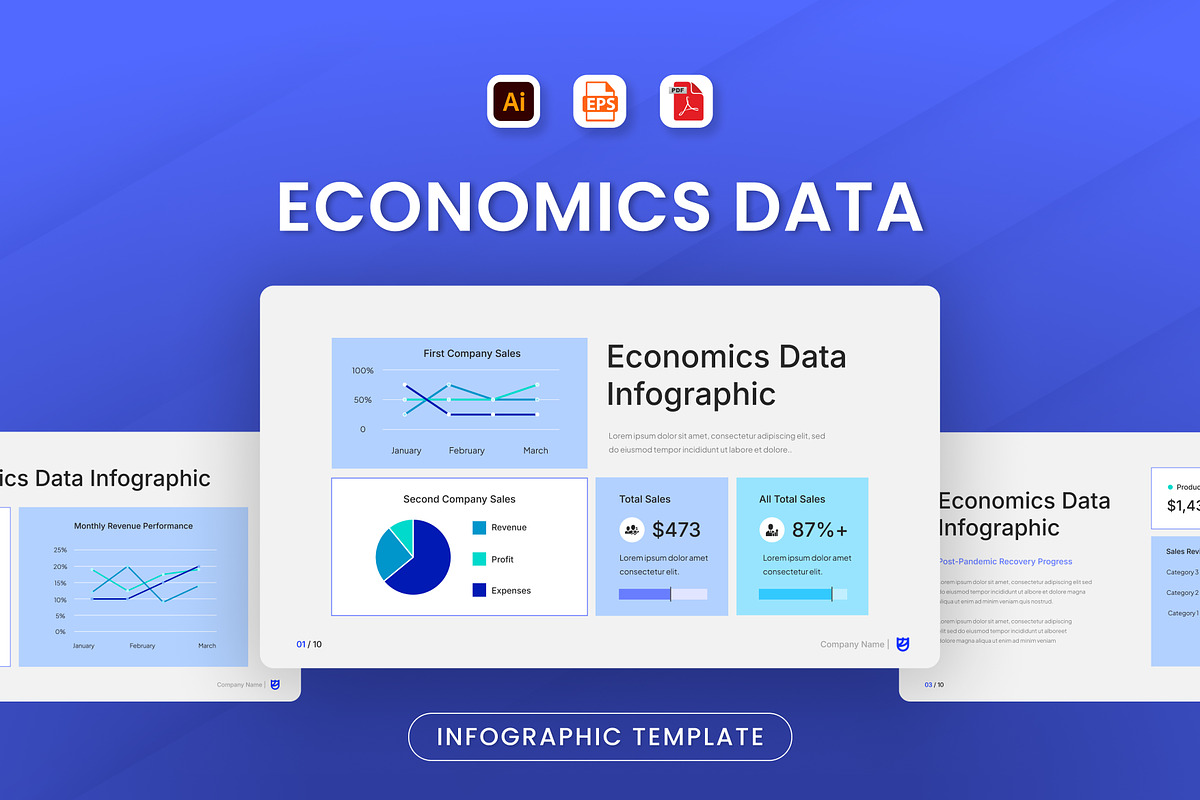
Each of the three unique infographic slides is crafted with purpose — balancing aesthetic appeal and information density. The clean, structured layout ensures that key data points stand out while maintaining visual harmony. From trend lines and performance meters to comparison charts and milestone markers, every element supports data readability and audience engagement. The vector-based design ensures zero pixelation — perfect for high-resolution print, presentation slides, and digital sharing.
Key Features You Can Count On
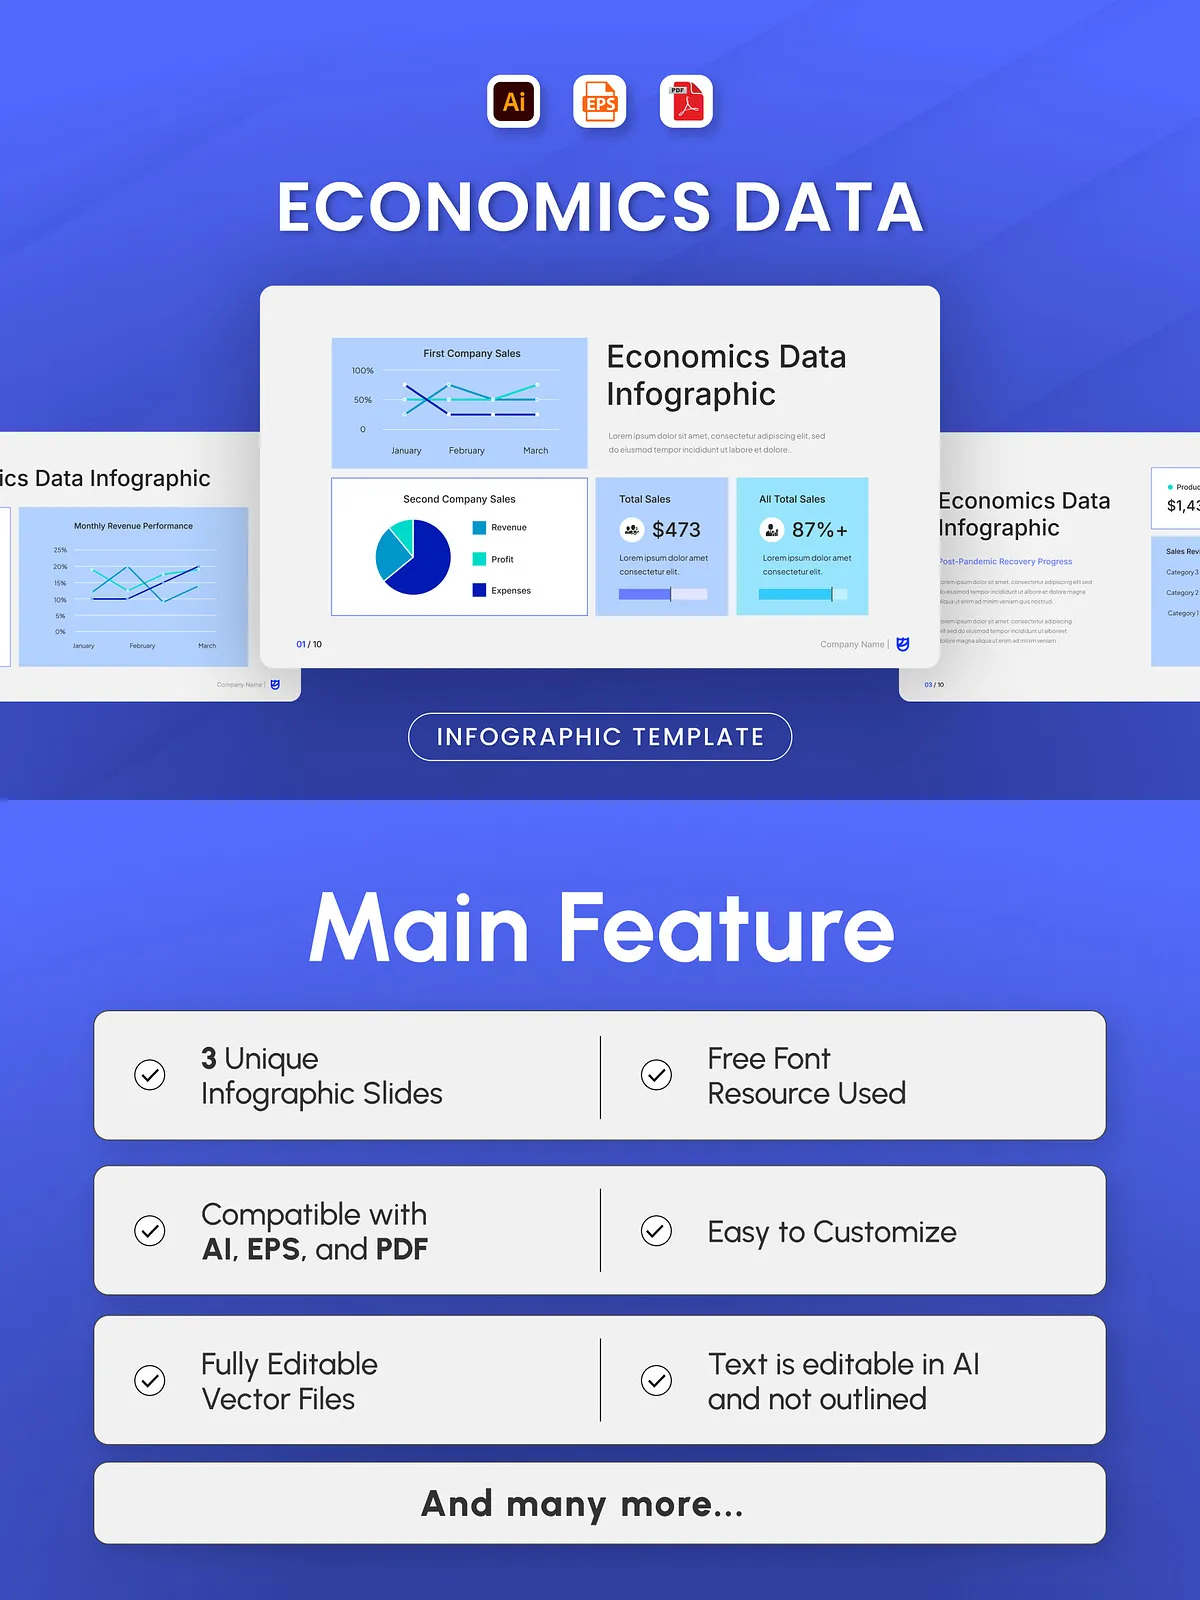
- 3 Customizable Infographic Slides – Designed for different types of economic communication: trend analysis, comparative data, and performance summaries.
- Editable Vector Files – Fully editable in Adobe Illustrator (AI), EPS, and PDF formats. Change text, colors, icons, and layouts without limitations.
- Text-Editable Layers – All text remains fully editable (not outlined), allowing quick updates to data, labels, and titles.
- Professional Layouts with Vector Elements – Sharp lines, clean shapes, and consistent spacing for a polished, corporate-grade look.
- Free, Legally Safe Fonts – No licensing issues — all fonts used are free for commercial and personal use.
- Easy to Customize – Simply replace placeholder data with your own. Drag, drop, and adjust — no design expertise required.
Perfect For: Real-World Applications in Business & Academia
This infographic is not just a template — it’s a ready-to-use tool for professionals who need to deliver data clarity under pressure. Its versatility makes it ideal for:
Who Should Use This Template?
- Finance & Corporate Analysts – Present quarterly results, macroeconomic trends, or sector performance with authority.
- Business Consultants – Deliver actionable insights during client strategy sessions or performance reviews.
- University Lecturers & Students – Teach economic concepts with engaging, accurate visuals in lectures and research presentations.
- Government & Policy Departments – Share public economic data with citizens or stakeholders in an accessible format.
- Startup Founders & Investors – Communicate growth projections, funding milestones, or market adoption clearly during pitches.
Why This Outshines Generic Templates
Unlike basic chart designs, this infographic follows data visualization best practices: minimal clutter, logical flow, and visual hierarchy. It guides the viewer’s eye naturally through the information — from context to conclusion. The consistent color scheme (neutral tones with strategic accent highlights) ensures professionalism, while the layout can be adapted to any brand or report style.
Seamless Workflow from Concept to Delivery
- Update numbers and labels in seconds
- Swap icons to match your industry or brand
- Reposition sections for different screen sizes
- Export for PowerPoint, web, PDF, or print
- Share a high-impact visual story instantly
Turn Data Into Decisions — Fast and with Confidence
Stop spending hours struggling to make data look good. This ready-to-edit, high-impact infographic gives you the tools to communicate complex economic information clearly, quickly, and powerfully. From boardroom presentations to classroom lectures, this is the visual edge you need to lead conversations — not just participate in them.
Download the Economics Data Infographic today and elevate every report, briefing, and analysis you deliver.